Satellite Data Show Extent of China’s Crippling Lockdowns
The data, which tracks activity on building sites from satellites, show major slumps at ports and in construction.

(Bloomberg) -- Chinese port activity fell below levels seen during the first coronavirus outbreak in 2020 and construction has plummeted, satellite data show, suggesting official economic figures will likely worsen as Covid lockdowns spread.
Satellite images are becoming an important real-time data tool to measure the impact of China’s worst coronavirus outbreak since 2020. Official numbers are released only monthly, and are increasingly coming under scrutiny as Beijing sticks to its ambitious growth target of about 5.5% even though its Covid Zero approach has forced major hubs like Shanghai to shut down.
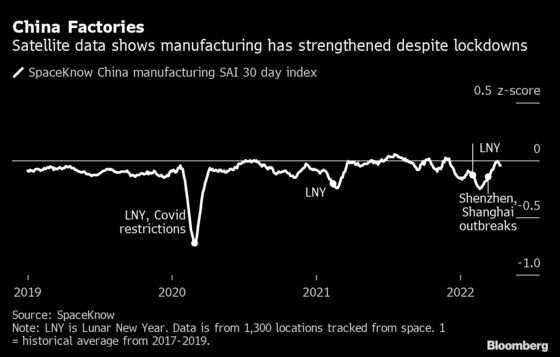
New York-based SpaceKnow, which tracks activity at more than 1,300 factories from space, said manufacturing output remained strong through the lockdowns in March and early April, although inventories are building up. That’s likely a sign of logistical snarls as coronavirus restrictions cause major disruptions and shortages of trucks able to move goods to ports and around the country.
The data from SpaceKnow and Chinese company Four Squares Technology Ltd., which tracks activity on building sites from satellites, show major slumps at ports and in construction. However, manufacturing and retail activity tracked through satellite images appear to back the trend in official data so far.
Factory output nationwide was in line with normal seasonal patterns, although the data shows output was below average levels for most of March, according to SpaceKnow.
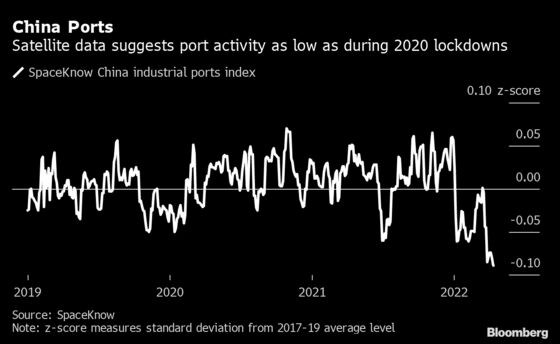
The picture is very different for Chinese ports, where activity is back to the low levels seen during the 2020 lockdowns. Inland waterway traffic, referring to freight transported on rivers, is currently well below the lows of January 2020, according to SpaceKnow.
There are signs that factory inventories are piling up. An increasing flow of goods is stuck waiting at export storage areas, according to SpaceKnow, while automobiles made for domestic consumption are piling up at distribution centers, suggesting cars are being made but not being sold.
Companies from Microsoft Corp. to Texas Instruments Inc. have warned of disruptions and hits to their revenue because of the lockdowns. 3M Co.’s top executive said in an interview the restrictions in China are adding to supply chain strains, with difficulties getting workers in and out of plants and reduced transport capacity.
Consumer Demand
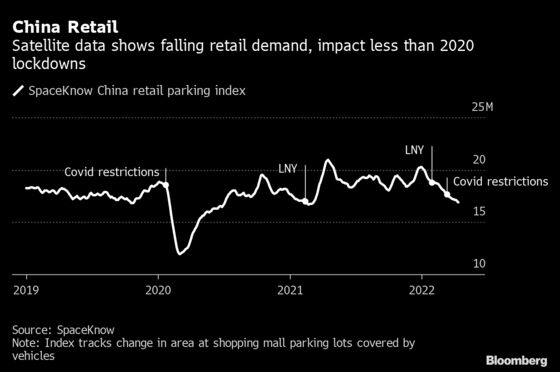
Retail demand has fallen sharply since large cities like Shanghai and Shenzhen tightened restrictions on March 13, but still significantly less than the amount seen in China’s first virus outbreaks in 2020. SpaceKnow measures retail activity by tracking changes in the number of vehicles on parking lots at shopping malls in China.
Official data last week showed retail sales contracted 3.5% in March from a year earlier, compared with a 15.8% plunge during the 2020 lockdown.
With retail sales growth weak this year, the driving force in China’s economy is meant to be investment, especially in infrastructure. However, the satellite data show the much-anticipated investment stimulus didn’t materialize in March, despite official data showing a 12.5% increase in fixed-asset investment in infrastructure in March from a year ago.
Satellite images from Four Squares Technology indicate plummeting construction activity in China’s most economically important regions during March.
The area of new construction in China’s three main economic belts around the cities of Shenzhen, Shanghai and Beijing fell 57% year-on-year in March, according to Four Squares. In the belt around Shanghai, the area of new construction fell 83% in the period.
Road construction also fared badly, with 8,759 kilometers (5,443 miles) under construction in the central and western regions of China in March, a year-on-year decrease of 10%.
That suggests that China hasn’t been able to isolate its construction sector from the impact of lockdowns. Data on the use of construction machinery from Japanese company Komatsu Ltd. also suggested a decline in activity in March.
Mismatches between official figures and high-frequency data add to skepticism about Chinese economic statistics. Growth rates are a key performance indicator for government officials, who are vying for promotion ahead of a Communist Party congress in the fall. They could, as a result, be incentivised to report strong data.
“The credibility issues surrounding China’s economic data are likely to become far more salient this year,” said Logan Wright, head of China markets research at Rhodium Group. Insistence that China is growing at rapid rates this year despite property and Covid-related headwinds could “jeopardize” the long term credibility of official data, he added.
©2022 Bloomberg L.P.